Mathematical annotations in plots
Base R supports an array of mathematical expressions obeying TeX-like rules that can be added to a figure. Adding mathematical notation proceeds via two steps. First, a mathematical expression is defined via the expression or substitute command. The expression is then added to an existing figure via the text, mtext, axis, and legend commands. The command ?plotmath provides a breakdown of the notation used for define various equations, relations, and symbols.
Table of contents
1. Mathematical annotations via text
Content.
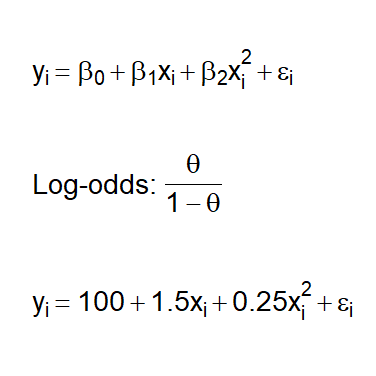
# Define regression equation via
# 'expression' and 'plotmath'
mtxt <- expression(
  y[i] == beta[0] + beta[1]*x[i] + beta[2]*x[i]^2 + epsilon[i]
)
# Add to figure
text( 0, .85, mtxt, pos = 4, cex = 1.75 )

# Combining regular text and equations
# via 'expression', 'paste', and 'plotmath'
mtxt <- expression(
  paste(
    "Log-odds: ",
    frac( theta, 1 - theta )
  )
)
# Add to figure
text( 0, .5, mtxt, pos = 4, cex = 1.75 )

# Sustituting values from a variable via
# 'substitute' and 'plotmath'
vec <- c( 100, 1.5, 0.25 ) # Vector of coefficients
mtxt <- substitute(
  y[i] == b_0 + b_1*x[i] + b_2*x[i]^2 + epsilon[i],
  list( b_0 = vec[1], b_1 = vec[2], b_2 = vec[3] )
)
# Add to figure
text( 0, .15, mtxt, pos = 4, cex = 1.75 )

2. Mathematical annotations via mtext or axis
Content.
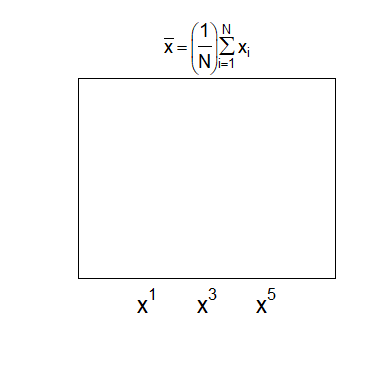
# Define summation and division via
# 'expression' and 'plotmath'
mtxt <- expression(
  bar(x) == bgroup( "(", frac( 1, N ), ")" )*sum( x[i], i == 1, N )
)
# Add as figure's title
mtext( mtxt, side = 3, cex = 1.15 )

# Define vector of expressions
mtxt <- c(
  expression( x^1 ),
  expression( x^3 ),
  expression( x^5 )
)
# Add to figure axis
axis( 1, c( .25, .5, .75 ), mtxt, cex.axis = 1.5, tick = F )

3. Greek letters
Content.
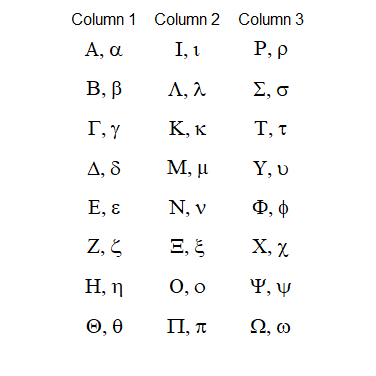
# Greek alphabet

greek_alphabet <- list(
  # Column 1
  expression( list( Alpha, alpha ) ),
  expression( list( Beta, beta ) ),
  expression( list( Gamma, gamma ) ),
  expression( list( Delta, delta ) ),
  expression( list( Epsilon, epsilon ) ),
  expression( list( Zeta, zeta ) ),
  expression( list( Eta, eta ) ),
  expression( list( Theta, theta ) ),
  # Column 2
  expression( list( Iota, iota ) ),
  expression( list( Lambda, lambda ) ),
  expression( list( Kappa, kappa ) ),
  expression( list( Mu, mu ) ),
  expression( list( Nu, nu ) ),
  expression( list( Xi, xi ) ),
  expression( list( Omicron, omicron ) ),
  expression( list( Pi, pi ) ),
  # Column 3
  expression( list( Rho, rho ) ),
  expression( list( Sigma, sigma ) ),
  expression( list( Tau, tau ) ),
  expression( list( Upsilon, upsilon ) ),
  expression( list( Phi, phi ) ),
  expression( list( Chi, chi ) ),
  expression( list( Psi, psi ) ),
  expression( list( Omega, omega ) )
)

# x-axis coordinate
xc <- rep( c(.2,.5,.8), each = 8 )
# y-axis coordinates
yc <- rep( seq( 1, 0, length.out = 8 ), 3 )
# Text size
sz <- 1.3

for ( i in 1:24 ) {
  text( xc[i], yc[i], greek_alphabet[[i]], cex = sz )
}
axis( 3, c(.2,.5,.8), paste0( 'Column ', 1:3 ),
      tick = F, line = -.5 )
