Add Node Shape
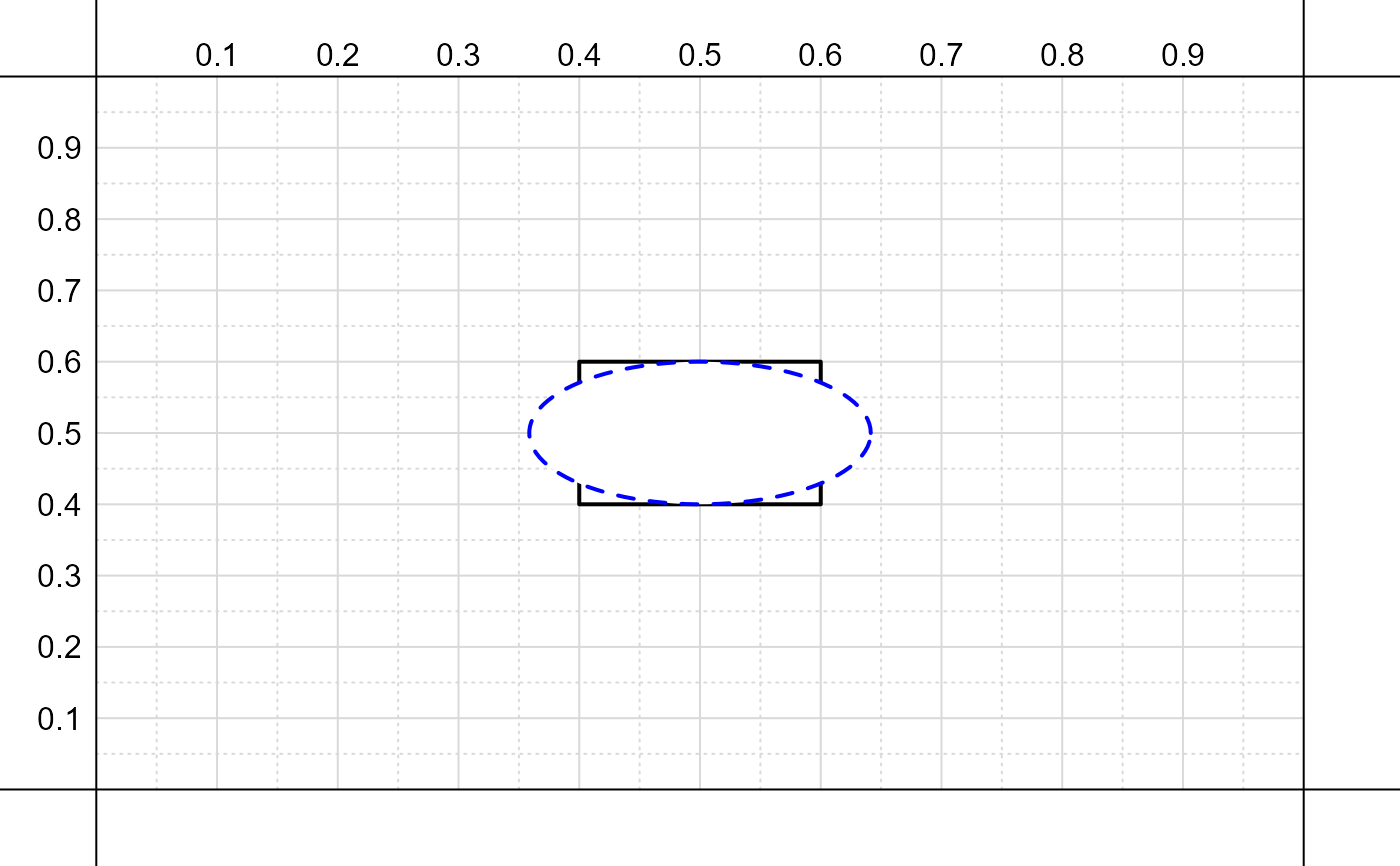
add_node_shape.RdGiven a list with the x and y-axis coordinates for the bottom, left, top, and right of the internal text box, draws a specified shape on an existing plot.
add_node_shape(
  nd,
  shape = "box",
  shape.col = "white",
  shape.lwd = 2,
  shape.border = "black",
  shape.lty = 1,
  shape.x = NA,
  shape.y = NA,
  xpd = NA
)
Arguments
- nd
A named list of vectors with the Cartesian coordinates for the bottom, left, top, and right of the internal text box for the node.
- shape
The default shape for nodes, either 'box', or 'circle'.
- shape.col
The fill color for the node.
- shape.lwd
The line wide for the node border.
- shape.border
The mode border color (
NAwill suppress the border).- shape.lty
The line type for the node.
- shape.x
The fixed width for the x-axis.
- shape.y
The fixed height for the y-axis.
- xpd
A logical value or NA. If
FALSE, all plotting is clipped to the plot region, ifTRUE, all plotting is clipped to the figure region, and if NA, all plotting is clipped to the device region.
