Tutorial
Tutorial.Rmd
library(pathdiagrams)Table of contents
- Introduction
- Creating a diagram and adding nodes
- Determining spacing between nodes
- Node aesthetics (shape, fill color, etc.)
- Text aesthetics (size, color, etc.)
- Bold and italic text
- Arrows and lines connecting nodes
1) Introduction
The pathdiagrams package provides an extension to base R’s plotting tools for creating various types of path diagrams. The package can be used to help create diagrams displaying various structural equation model (SEM) analyses, such as factor or path analyses. The package can also be used to create CONSORT-type diagrams (subject enrollment and retention in a study).
2) Creating a diagram and adding nodes
Creation of a path diagram proceeds in three steps:
- Create a blank figure using ‘pd_base_figure’;
- The x and y-axis boundaries for the figure are between 0 and 1.
- By default, guidelines are provided to help with positioning.
- Create a list with details on the nodes to draw using ‘pd_node’;
- The function needs a name for the node, a vector giving the x and y-axis locations, and the text content for the node.
- Nodes are created centered at the specified x and y-axis values.
- Multiple calls to ‘pd_node’ can be strung together using the pipe operator ‘|>’.
- Draw the nodes on the figure using ‘pd_draw_node’.
- Global options (fill color for the nodes, line width, etc.) can be specified.
# Creates a base figure with lower and upper limits from 0 to 1
pd_base_figure( new = FALSE )

# Specify nodes to add
lst_nodes <- list() |>
  pd_node(
    'N01', c(x = .3, y = .8), string = 'Node-01'
  ) |>
  pd_node(
    'N02', c(x = .3, y = .6), string = 'Node-02',
    # Connect line from Node-02 to Node-01
    to = 'top - N01.bottom'
  ) |>
  pd_node(
    'N03', c(x = .3, y = .4), string = 'Node-03',
    # Connect line from Node-03 to Node-02
    to = 'top - N02.bottom'
  )

# Draw nodes on figure, setting all node backgrounds to white via
# 'col' argument in the 'polygon' function
pd_draw_nodes( lst_nodes, args.polygon = list( col = 'white' ) )
3) Determining spacing between nodes
Rather than specifying values for the x and y-axis, users can instead specify the location of subsequent nodes relative to a previously created node, to facilitate adding nodes with equivalent distances from each other.
pd_base_figure( new = FALSE, guidelines = FALSE )

lst_nodes <- list() |>
  # Specify first node
  pd_node(
    'N01', c( x = .5, y = .9 ), string = 'Node-01'
  ) |>
  # Subsequent node locations are relative to first node, based on node's height
  # and width
  pd_node(
    'N02', from = c( N01.center = -1.25, N01.bottom = -1.5 ), string = 'Node-02',
    to = 'top - N01.bottom'
  ) |>
  pd_node(
    'N03', from = c( N01.center = 0, N01.bottom = -1.5 ), string = 'Node-03',
    to = 'top - N01.bottom'
  ) |>
  pd_node(
    'N04', from = c( N01.center = 1.25, N01.bottom = -1.5 ), string = 'Node-04',
    to = 'top - N01.bottom'
  )

pd_draw_nodes( lst_nodes )
4) Node aesthetics (shape, fill color, etc.)
Users can provide lists of arguments to change node and text characteristics:
pd_base_figure( guidelines = FALSE, new = FALSE )

lst_nodes <- list() |>
  pd_node(
    'N01', c( x = .25, y = .7 ), string = 'N01',
    # Node is an ellipse instead of a rectangle
    shape = 'ellipse',
    # Change color and line width of border for node
    args.polygon = list( col = 'grey', lwd = 3 )
  ) |>
  pd_node(
    'N02', c( x = .75, y = .7 ), string = 'N02',
    # Change font size and color
    args.text = list( cex = 2, col = 'red' )
  ) |>
  pd_node(
    'N03', c( x = .5, x = .3 ), string = 'N03',
    to = c(
      'top <- N01.bottom', 'top -> N02.bottom'
    ),
    # Change line width and color
    args.arrows = list(
      col = 'blue', lwd = 3
    )
  )

pd_draw_nodes( lst_nodes )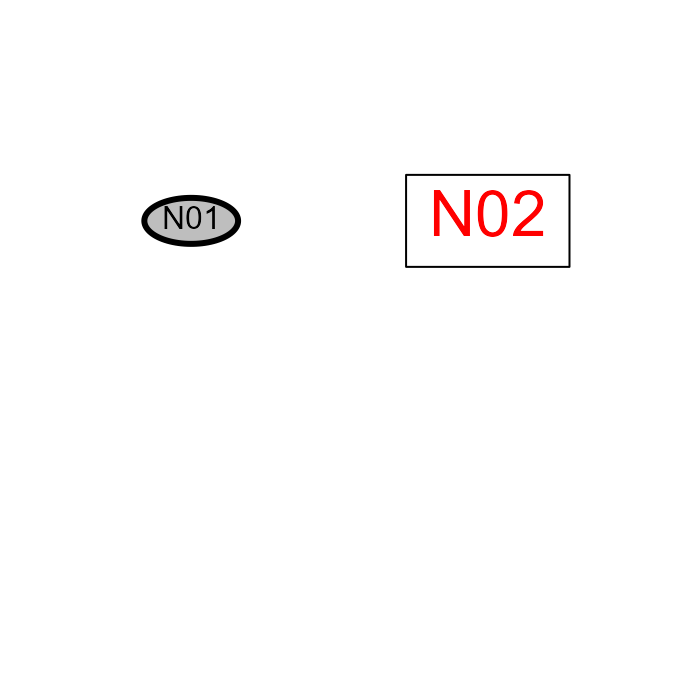
5) Text aesthetics (size, color, etc.)
Multiple options are also available for controlling the aesthetics of the text content of a node. Again, options separated by the pipe symbol ‘|; are added to the end of the input string. Options for text aesthetics are in the form ’t_=’ with the underscore replaced by an appropriate letter. For example, to change the color of the text in a node to red, the full input string would be:
‘Text content|x=value|y=value|tc=red’
The following figure showcases the range of options and how the options should be specified:
create_base_figure( guidelines = FALSE, new = FALSE )

inputs <- c(
  # Change text size
  N01 = 'Text-01|x=.5|y=.9|ts=2',
  # Change text color
  N02 = 'Text-02|x=.5|y=.65|tc=red',
  # Multiple lines of text
  N03 = 'Text-03\nText-04|x=.5|y=.4',
  # Change spacing between lines
  N04 = 'Text-05\nText-06|x=.5|y=.15|th=.08'
)
nodes <- add_nodes( inputs, output = TRUE, text.size = .85 )

# How to specify options
text( .5, c( .78, .58, .02 ),
      c( 'ts=2', 'tc=red', 'th=.08' ),
      cex = .85, xpd = NA
)
6) Bold and italic text
Forthcoming.
create_base_figure( guidelines = FALSE, new = FALSE )

inputs <- c(
  # Bold text
  N01 = '**Bold** text|x=.5|y=.9',
  N02 = '**Bold** text\n   More  **Bold** text|x=.5|y=.65',
  # Italic text
  N01 = '*Italic* text|x=.5|y=.4',
  N02 = '*Italic* text\n   More *italic* text|x=.5|y=.15'
)
nodes <- add_nodes( inputs, output = TRUE, text.size = .85 )
7) Arrows and lines connecting nodes
The pathdiagrams package also allows a user to add either arrows or lines to connect nodes. Details of what lines to draw and the aesthetics of these lines are specified via a call to the ‘paths’ argument for the ‘add_nodes’ function.
When nodes are labeled, a line from one node to another can be added via a input string of the following form:
‘Node label|start position|Node label|end position’
There are 8 positions that a user can specify: ‘top’, ‘topright’, ‘right’, ‘bottomright’, ‘bottom’, ‘bottomleft’, ‘left’, and ‘topleft’.
create_base_figure( guidelines = FALSE, new = FALSE )

# Define nodes
inputs <- c(
  N01 = 'Node-01|x=.1|y=.5',
  N02 = 'Node-02|x=.9|y=.5'
)

# Arrow from node 'N01' to 'N02'
paths <- c(
  'N01|right|N02|left'
)

nodes <- add_nodes( inputs, paths, output = TRUE )
In cases where a user wants to add a line that is not defined relative to a pair of nodes, one can provide the x and y-axis coordinates instead:
create_base_figure( guidelines = FALSE, new = FALSE )

# Define nodes
inputs <- c(
  N01 = 'Node-01|x=.5|y=.75',
  N02 = 'Node-02|x=.5|y=.25',
  N03 = 'Node-03|x=.9|y=.5'
)

paths <- c(
  # Arrow between Node-01 and Node-02
  'N01|bottom|N02|top',
  # Arrow defined at fixed coordinates
  'x,y|.5,.5|x,y|.7,.5'
)

nodes <- add_nodes( inputs, paths, output = TRUE )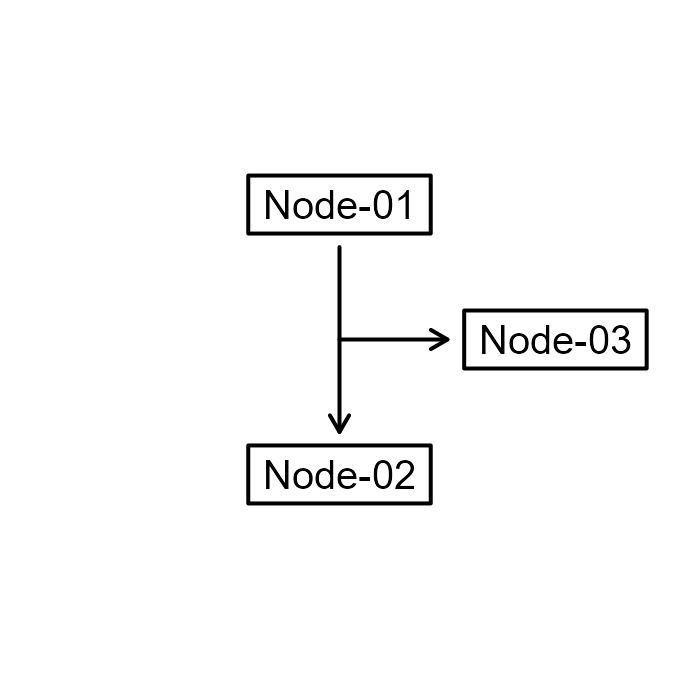
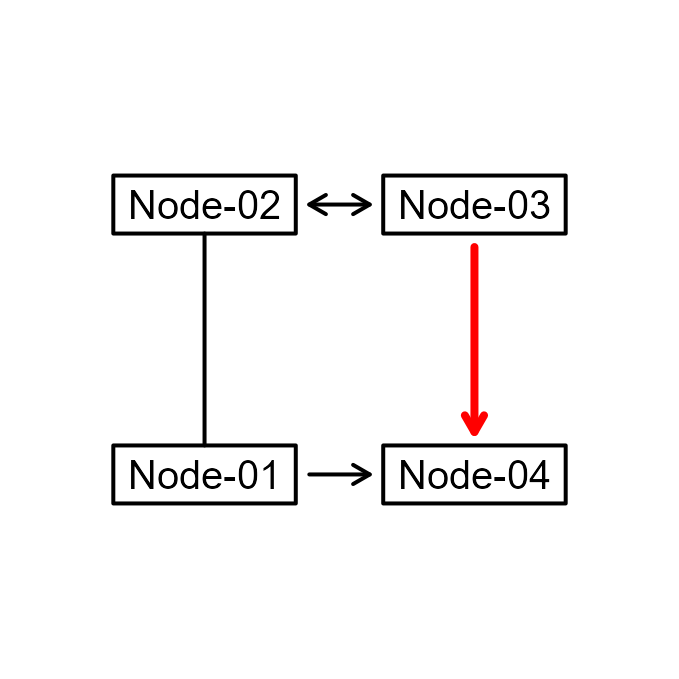
As before, additional options, separated by the pipe symbol ‘|’, can be added to the end of the input string that control the aesthetics of the lines:
create_base_figure( guidelines = FALSE, new = FALSE )

# Define nodes
inputs <- c(
  N01 = 'Node-01|x=.25|y=.25',
  N02 = 'Node-02|x=.25|y=.75',
  N03 = 'Node-03|x=.75|y=.75',
  N04 = 'Node-04|x=.75|y=.25'
)

paths <- c(
  # Arrow between Node-01 and Node-04
  'N01|right|N04|left',
  # Line between Node-01 and Node-02
  'N01|top|N02|bottom|lp=0|ll=0',
  # Double-headed arrow
  'N02|right|N03|left|cd=<->',
  # Set line width and color
  'N03|bottom|N04|top|lw=4|lc=red'
)

nodes <- add_nodes( inputs, paths, output = TRUE )