Add Multiple Nodes to a Path Diagram
add_nodes.RdFunction to add multiple nodes (and associated paths) to an existing path diagram.
add_nodes(
  input,
  paths = NULL,
  output = F,
  shape = "box",
  shape.col = "white",
  shape.lwd = 2,
  shape.border = "black",
  shape.lty = 1,
  shape.pad = 0.5,
  shape.x = NA,
  shape.y = NA,
  text.size = 1.25,
  text.col = "black",
  text.spacing = NULL,
  path.pad = 0.025,
  path.lwd = 2,
  path.col = "black",
  path.length = 0.1,
  path.angle = 30,
  path.lty = 1,
  path.code = "->",
  xpd = NA,
  ignore_asterisk = TRUE,
  add = TRUE
)
Arguments
- input
A vector of labeled character strings; see details for more information.
- paths
An optional vector of labeled character strings; see details for more information.
- output
Logical; if
TRUEreturns a list with the x and y-axis coordinates for each node.- shape
The default shape for nodes, either 'box', 'circle', or 'blank'; options for individual nodes can be specified with the tag
ns=.- shape.col
The default color for nodes; options for individual nodes can be specified with the tag
nc=.- shape.lwd
The default line width for node borders; options for individual nodes can be specified with the tag
nw=.- shape.border
The default border color for nodes; options for individual nodes can be specified with the tag
nb=.- shape.lty
The default border line type for nodes; options for individual nodes can be specified with the tag
nt=.- shape.pad
The default space between lines of text for nodes; options for individual nodes can be specified with the tag
np=.- shape.x
The default fixed width for nodes; options for individual nodes can be specified with the tag
nx=.- shape.y
The default fixed height for nodes; options for individual nodes can be specified with the tag
ny=.- text.size
The default size for text content; options for individual nodes can be specified with the tag
ts=.- text.col
The default color for text content; options for individual nodes can be specified with the tag
tc=.- text.spacing
The space between multiple lines of text; options for individual nodes can be specified with the tag
th=.- path.pad
The space between a line or arrow and a node; options for individual nodes can be specified with the tag
lp=.- path.lwd
The default line width for paths; options for individual nodes can be specified with the tag
lw=.- path.col
The default line color for paths; options for individual nodes can be specified with the tag
lc=.- path.length
The default arrowhead length for paths; options for individual nodes can be specified with the tag
ll=.- path.angle
The default angle of arrowheads for paths; options for individual nodes can be specified with the tag
la=.- path.lty
The default line type for paths; options for individual nodes can be specified with the tag
lt=.- path.code
The default arrow direction for paths; options for individual nodes can be specified with the tag
cd=. Directions are specified with the symbols->,<-,<->, or-.- ignore_asterisk
Logical; if
TRUEignores asterisks for dimension purposes since they are used to indicate bold/italic font.- add
Logical; if
TRUEadds nodes (and paths if specified) to an existing figure.
Details
Each node is specified via a text string in the format:
"Text content|x=value|y=value|..."
substituting value with the respective x and
y-axis coordinate positions for the node, and ...
referring to additional options controlling node
aesthetics.
Options are specified as a tag followed by a value; for
example, to draw a node as an ellipse, one uses the
combined tag and value: ns=circle. Multiple
options can be specified by separating them with the
| symbol.
Paths (lines or arrows) can be drawn between existing nodes whose string input is labeled, via the format:
"Label|coordinate|Label|coordinate|..."
where Label is the label in the string
vector (i.e., the name attribute), and coordinate
is one of eight values: bottom, left,
top, right, bottomleft, topleft,
topright, or bottomright.
As before, additional aesthetic options can be specified
via a tag and value, with multiple cases separated by the
| symbol. For example, the width of a path line
can be set via the tag and value: lt=2.
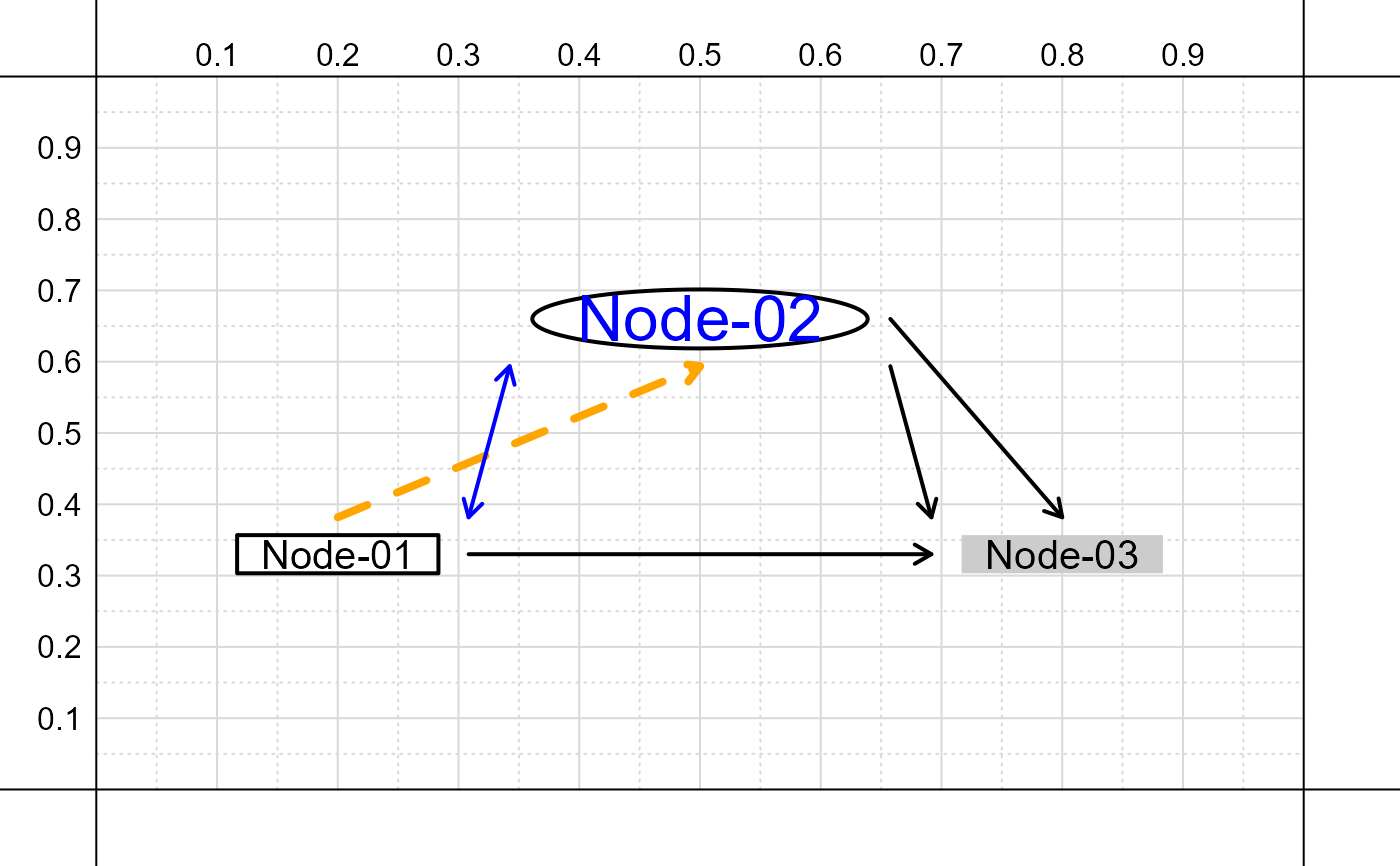
Examples
# Define vector of string inputs for nodes to draw
input = c(
  # [Node label] = "Text|x=value|y=value|..."
  N01 = 'Node-01|x=.2|y=.33',
  # Set node shape to ellipse; resize and color text
  N02 = 'Node-02|x=.5|y=.66|ns=circle|ts=2|tc=blue',
  # Color node and remove border
  N03 = 'Node-03|x=.8|y=.33|nc=grey80|nb=NA'
)

# Define vector of string inputs to draw paths
# between labeled nodes specified in 'input'
paths = c(
  # Start of path    End of path      Options
  # Label|coordinate|Label|coordinate|...
  'N01|right|N03|left',
  # Connect various nodes and coordinates
  'N02|right|N03|top',
  'N02|bottomright|N03|topleft',
  # Orange dashed thick line
  'N01|top|N02|bottom|lc=orange|lt=2|lw=4',
  # Blue double-headed arrow with small arrowhead
  'N01|topright|N02|bottomleft|lc=blue|ll=.1|cd=<->'
)

# Create empty figure
create_base_figure()

# Add nodes and paths
add_nodes(
  input, paths = paths
)
