Draw Nodes on a Diagram
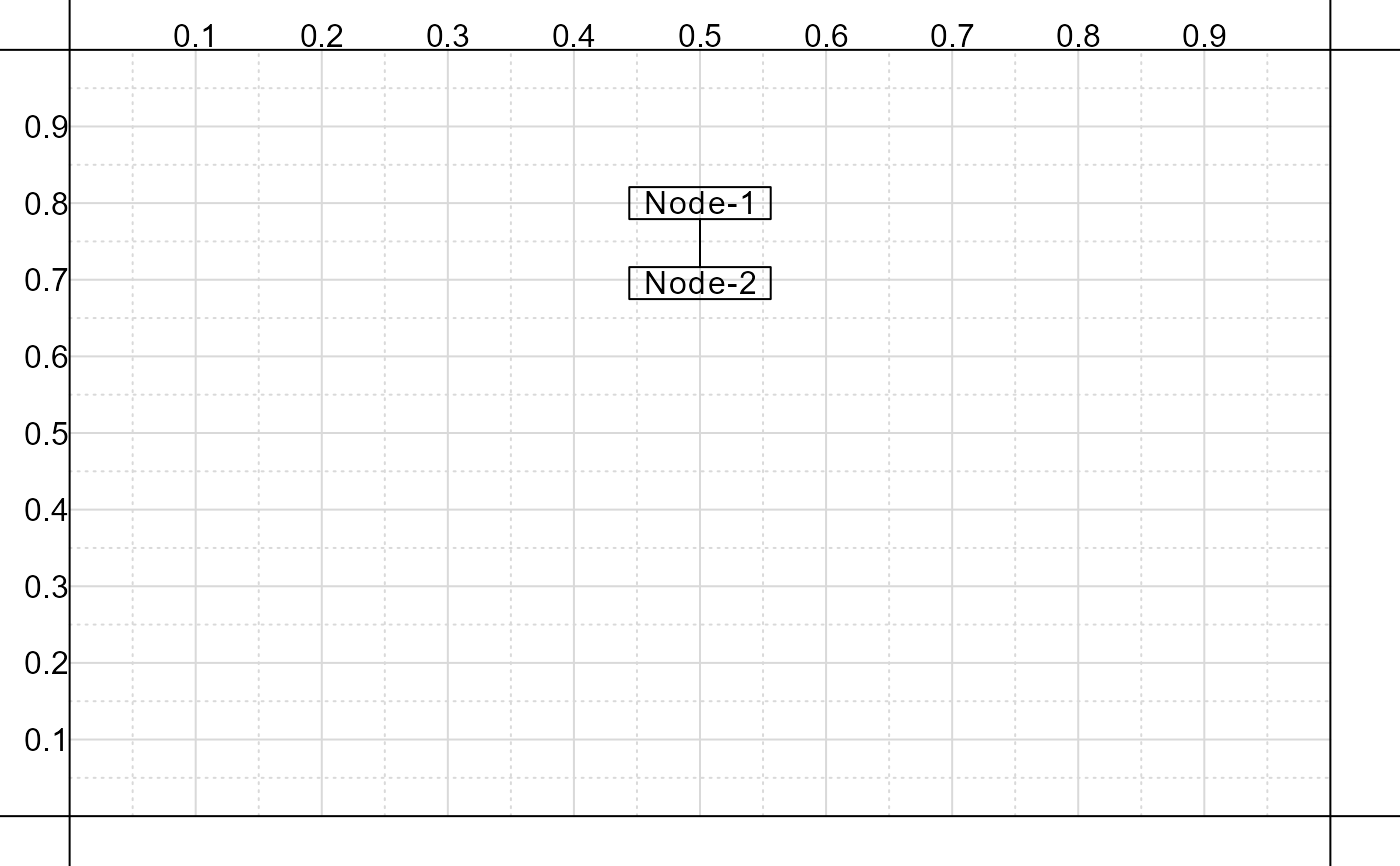
pd_draw_nodes.RdFunction that takes a list with node details and draws them on an existing figure (see [pathdiagrams::pd_base_figure]). Details for nodes can be added to a list via [pathdiagrams::pd_node].
pd_draw_nodes(
  inputs,
  args.polygon = NULL,
  args.text = NULL,
  args.arrows = NULL
)
Arguments
- inputs
A named list, where each element corresponds to a node to add to the figure.
- args.polygon
A named list, additional arguments to pass to the [graphics::polygon] function to apply to all nodes without pre-existing options already specified.
