Add Lines of Text to a Path Diagram
add_lines_of_text.RdA function to add multiple lines of text simultaneously to an existing path diagram.
add_lines_of_text(
  string,
  x = 0.5,
  y = 0.5,
  spacing = 0.8,
  spacing.fixed = F,
  shape.pad = 0.5,
  shape.pad_first = T,
  align = "left",
  cex = 1.1,
  col = "black",
  offset = 0,
  output = FALSE,
  shape = "blank",
  shape.col = "white",
  shape.lwd = 2,
  shape.border = "black",
  shape.lty = 1,
  shape.x = NA,
  shape.y = NA,
  xpd = NA,
  ignore_asterisk = TRUE,
  add = TRUE,
  ...
)
Arguments
- string
A vector of character strings to add to an existing plot.
- x
The x-axis coordinate to place all lines of text.
- y
The y-axis coordinate for the top line of the text.
- spacing
The spacing between lines of text, either as a percentage of the text height or as a fixed amount.
- spacing.fixed
Logical; if
TRUEspacing between lines will be by a fixed amount rather than a percentage.- shape.pad
The percentage of the text dimensions to use when padding the width and height of the box around the text.
- shape.pad_first
Logical; if
TRUEpad width and height of box around text based on the dimensions of the first line of text. Otherwise, pad based on the dimensions of the final line of text.- align
A vector giving the alignment of the text, either
left,right, orcenter. Values are recycled to match the number of lines.- cex
A vector giving the size of the text. Values are recycled to match the number of lines.
- col
A vector giving the color of the text. Values are recycled to match the number of lines.
- output
Logical; if
TRUEreturn list of coordinates for box around text.- shape
The default shape for nodes, either 'box', or 'circle'.
- shape.col
The fill color for the node.
- shape.lwd
The line wide for the node border.
- shape.border
The mode border color (
NAwill suppress the border).- shape.lty
The line type for the node.
- shape.x
The fixed width for the x-axis.
- shape.y
The fixed height for the y-axis.
- ignore_asterisk
Logical; if
TRUEignores asterisks for dimension purposes since they are used to indicate bold/italic font.- add
Logical; if
TRUEadds nodes (and paths if specified) to an existing figure.- ...
Additional arguments to the
textfunction.
Examples
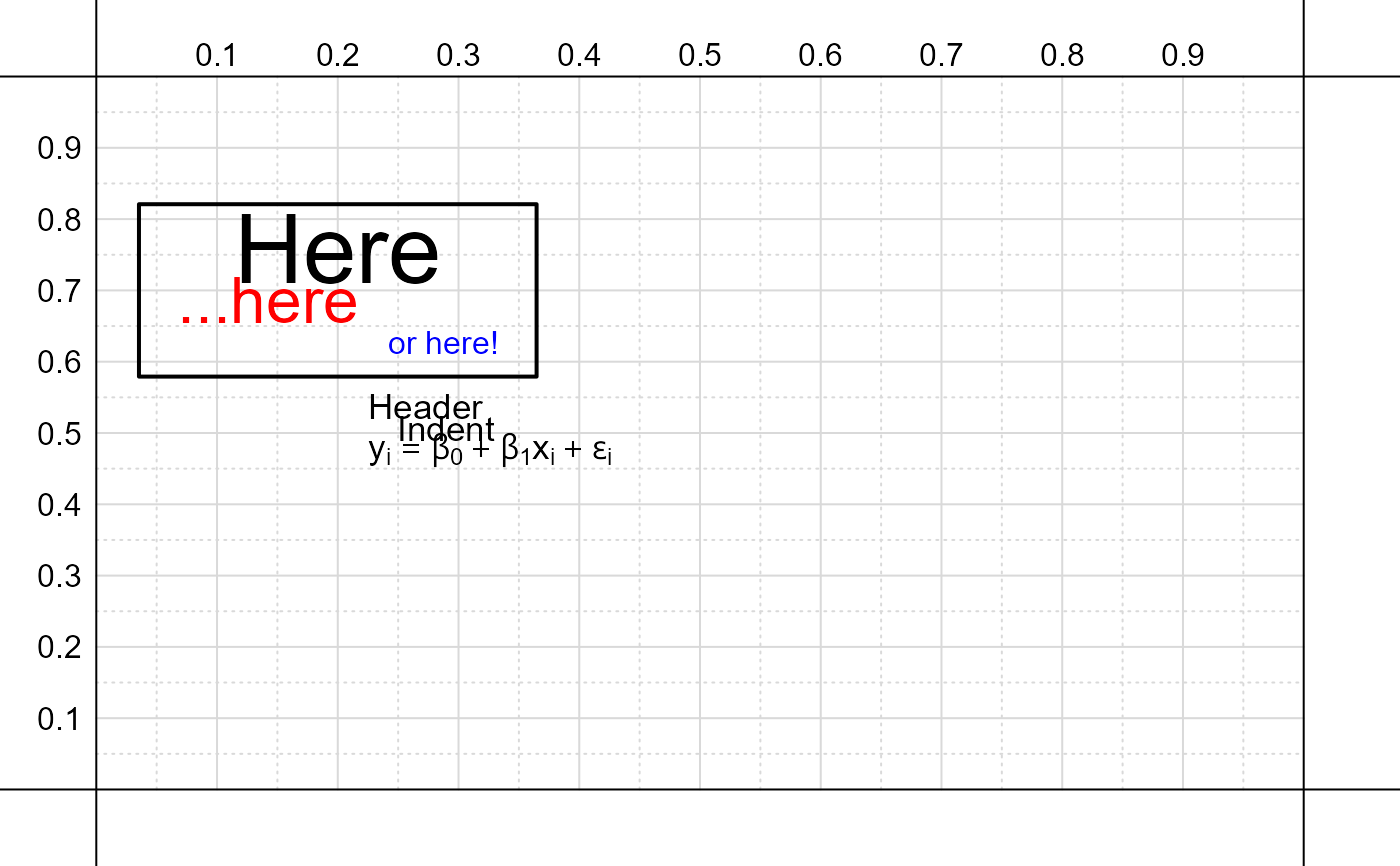
# Empty figure
create_base_figure()

# Several lines of text
string = c(
  'Header',
  '   Indent',
  expression( y[i] == beta[0] + beta[1]*x[i] + epsilon[i] )
)

# Add lines to figure
add_lines_of_text( string )

# Additional lines of text
string = c(
  'Here',
  '...here',
  'or here!'
)

# Vectorized options for size, color,
# and alignment
nd = add_lines_of_text(
  string, x = .2, y = .7,
  cex = c( 3, 2, 1 ),
  col = c( 'black', 'red', 'blue' ),
  align = c( 'center', 'left', 'right' ),
  output = T,
  xpd = NA
)

# Draw box around text
add_node_shape( nd, shape.col = NA )
