Evenly Distribute Nodes
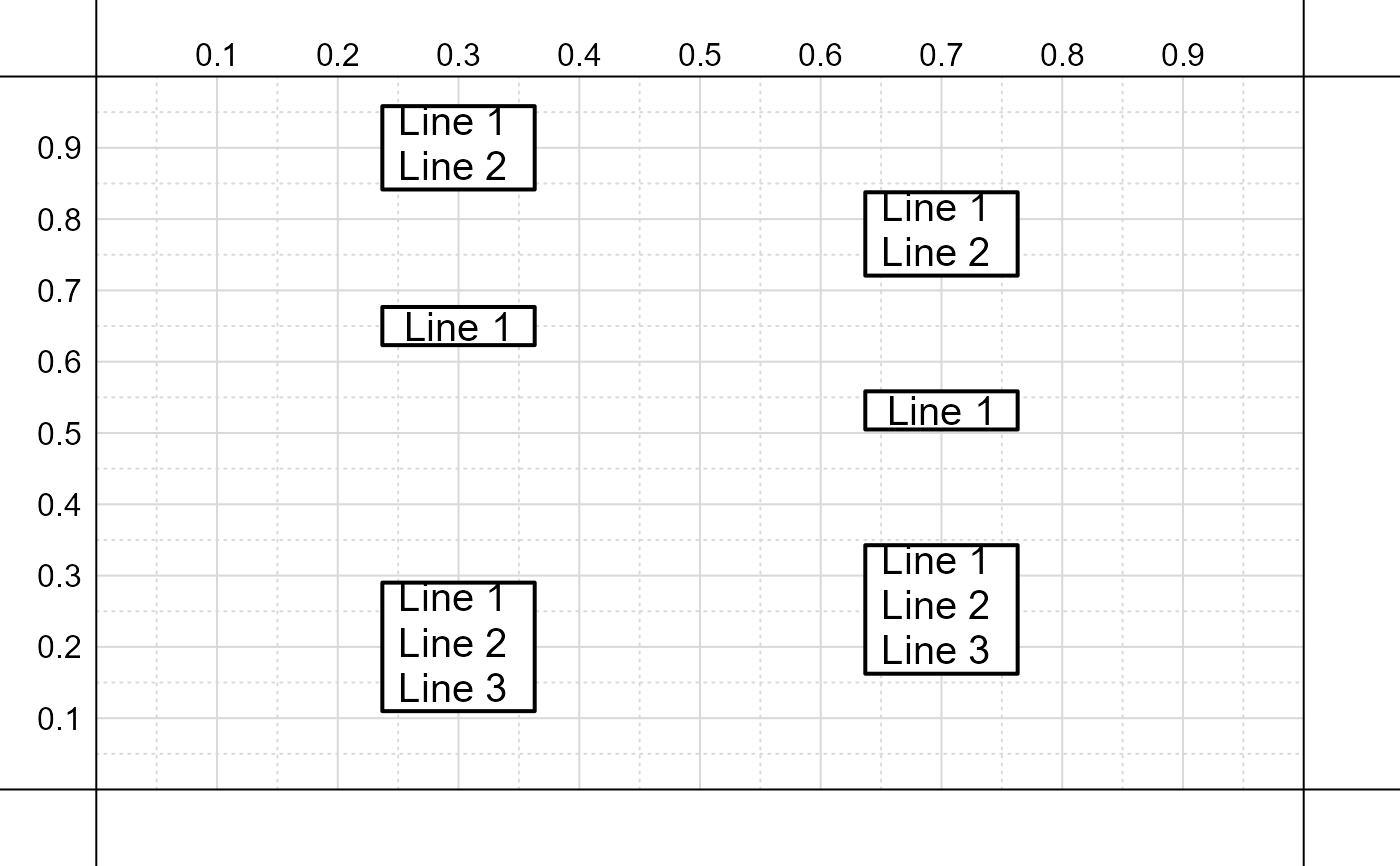
distribute.RdFunction that determines new y or x-axis values for the centers of a set of nodes in order to evenly distribute nodes vertically or horizontally.
distribute(nodes, vertical = TRUE, flush = FALSE, space = NULL, digits = 4)Arguments
- nodes
A list of lists, each list giving the x and y coordinates for the bottom, left, top, right and associated corners for a given node (e.g., see output of
add_nodesoradd_lines_of_text).- vertical
Logical; if
TRUEadjusts y-axis positions to have even spaces; otherwise adjusts x-axis positions to have even spaces.- flush
Logical; if
TRUEthe spacing for nodes is calculated such that the first and last nodes are flush with the margins.- space
An optional value for the space between nodes; if
NULLautomatically calculated.- digits
Number of digits to round output vector.
Value
A vector of values, either the new x or y-axis values for the centers of the nodes.
Examples
# Example for vertical spacing
create_base_figure( new = FALSE )

# Uneven spacing for y-axis positions
x_y <- c(
  # x-axis
  c( .3, .3, .3 ),
  # y-axis
  c( .9, .65, .2 )
)

# Input with placeholders for x and y-axis values
draft_inputs <- c(
  N01 = 'Line 1\nLine 2|x=[[1]]|y=[[4]]',
  N02 = 'Line 1|x=[[2]]|y=[[5]]',
  N03 = 'Line 1\nLine 2\nLine 3|x=[[3]]|y=[[6]]'
)
# Update with values from 'x_y'
inputs <- replace_with_values( draft_inputs, x_y )

# Add nodes to figure
nodes <- add_nodes( inputs, output = TRUE )

# Determine even y-axis positions
new_y <- distribute( nodes )
# Update 'inputs' with new values
x_y[1:3] <- .7; x_y[4:6] <- new_y
inputs <- replace_with_values( draft_inputs, x_y )

# Add nodes to figure
nodes <- add_nodes( inputs, output = TRUE )
